My Report on
Cyclistic
This article contains information on the background and purpose of the case study
as well as the the problem statement and information on the data
finally, I deliver trends, relationships and give my recomendations.
I welcome feedback and comments. I sincerely hope you enjoy it.
About Cyclistic
Business Model:
- Product: bike-sharing geotracked and network locked bikes across Chicago
- Customer types and revenue model: members (annual subscribers) and casual riders (single-ride and full-day purchasers)
- Value: Bicycle variety (broad consumer segments) and pricing flexibility
Product Background:
- 5,824 bicycles and 692 docking stations
- More than 50% of riders select traditional bikes
- 8% of riders opt for the assistive bike options
- 30% of users bike to commute to work each day
- Users are more likely to ride for leisure
- Casual riders have chosen Cyclistic for their mobility needs
Scenario
The director of marketing at Cyclistic, a bike-share company in Chicago, believes the company’s future success depends on maximising the number of annual memberships. As a junior data analyst working in the marketing analyst team, I have been tasked with determining how annual members and casual riders use Cyclistic bikes differently. Based on these insights, the team will design a new marketing strategy to convert casual riders into annual members. Nevertheless, Cyclistic executives must first approve recommendations, so they must be backed up with compelling data insights and professional data visualisations.
Purpose
This case study aims to discover and report actionable insights to inform decision-making at an executive level on the future marketing strategy of Cyclistic.
Characters and Goals
| Stakeholders | Expectations | Project/Business Goals |
|---|---|---|
| Cyclistic Executive Team | Compelling, relevant and straightforward insights to inform data-driven marketing decisions | Implementing strategic initiatives to promote business growth |
| Lily Moreno, Director of Marketing | Evidence to back up her theory and marketing recommendations | Convert a sizable group of casual riders to become annual members |
| Marketing analytics team | Uncovering the differences and motivations behind different customer types | Produce data-driven and actionable results to inform business decision making |
Scope of Work
The scope of work for the case study can be found here.
Problem Statement
Cyclistic has reached a stage where its growth can no longer rely on building general awareness and appealing to broad customer segments. It is time to zero in. The director of marketing and the financial analysts believe increasing annual memberships is pivotal to ensure future success. The director of marketing thinks the most suitable way to increase annual memberships would be to convert casual members because of their knowledge and the adoption of the Cyclistic program and services. However, to accomplish this feat, a deeper understanding of the differences in how annual and casual riders use bikes is needed.
The Data Source
Assumptions
The data collected as well as the collection process by Cyclistic, was done with integrity. Also, the security, reliability, originality, correctness and credibility were ensured by Cyclistic - the first-party data source.
Data location
The data used in this case study is located here, and it is made available by Motivate International Inc. (“Motivate”) under this license.
Data organisation
The data available to us consists of a repository made up of quantitative measurements collected over time. Each data point represents a single bike trip from one docking station to the next. Data is stored on a month-by-month basis in an excel file compressed into a ZIP file folder. The naming convention is YYYYMM-cyclistic-tripdata.zip. The date each zip folder was modified is also indicated to notify users of the most current data, and the file size is also listed.
Data quality
Data quality was assessed using the ROCCC criteria and determining the credibility and level of Bias of the data. ROCCC is an acronym that stands for reliable, original, comprehensive, current and cited. The results of the assessment are as follows:
- Reliable: Initial exploration of the data revealed the following reliability issues:
- Little urgency was placed on formatting as some end date-times came before the starting date-times for rides. Also, station IDs were not unique to stations, and multiple stations had different IDs.
- The data is about 97% complete, with most of the missing data coming from the start and end station names and IDs.
- Original: Data is first-party data collected and made available by Motivate International Inc. (“Motivate”).
- Comprehensive: The data is ample enough for exploration.
- Current: the data is the most recently modified data to get accurate results.
- Cited: The data is first-party data from Motivate International Inc. (“Motivate”).
Data ethics
- Licensing:The data has been made available by Motivate International Inc under these licensing terms.
- Privacy: The data is anonymised. There are no names or addresses that can link the data to the user.
- Security: The data is in a cloud repository that is managed by authorised Motivate employees and is secure by a trusted cloud services provider (Amazon Web Services).
- Accessibility: Under the license, the data is open and accessible.
data integrity
The majority of the data is complete, accurate and consistent with minor human errors.
data relevance
The data contains information relevant to accomplishing the business task.
Cleaning Process
After downloading and storing the data, exploration showed that the amount of data to be analysed is about 5 million rows. R and RStudio were used to perform analysis for the following reasons:
- Ease with handling vasts amounts of data.
- Code is reproducible.
The data was examined for misspelt words, null values, whitespaces, duplicates, inconsistent string and formatting to ensure data integrity. Data cleaning, transformation and visualisation changes are logged in a change log.
Data Analysis
As stated earlier, all code used to clean, analyze and visualize the data was done and published in with R in RStudio. The published document can be viewed here.
Insights and surprises
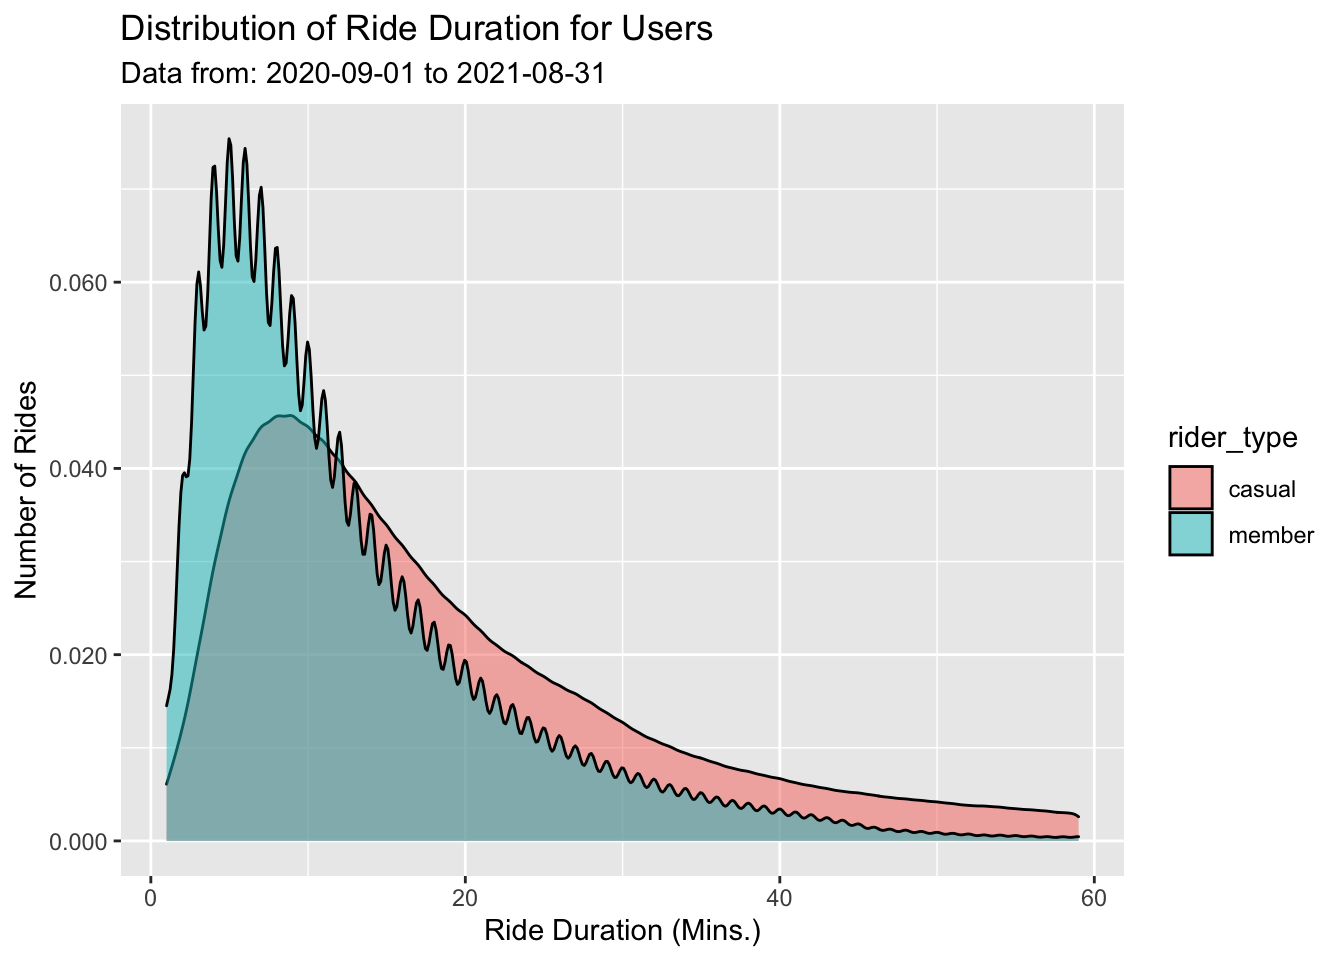
- Over the last year, annual members went on more bike rides than casual riders but the latter, on average, spend about 1.6 times longer on bike rides. Which makes sense as 50% of casual riders spend 15 minutes on bike rides compared to the 10 minutes spent by the same percentage of annual members on rides.
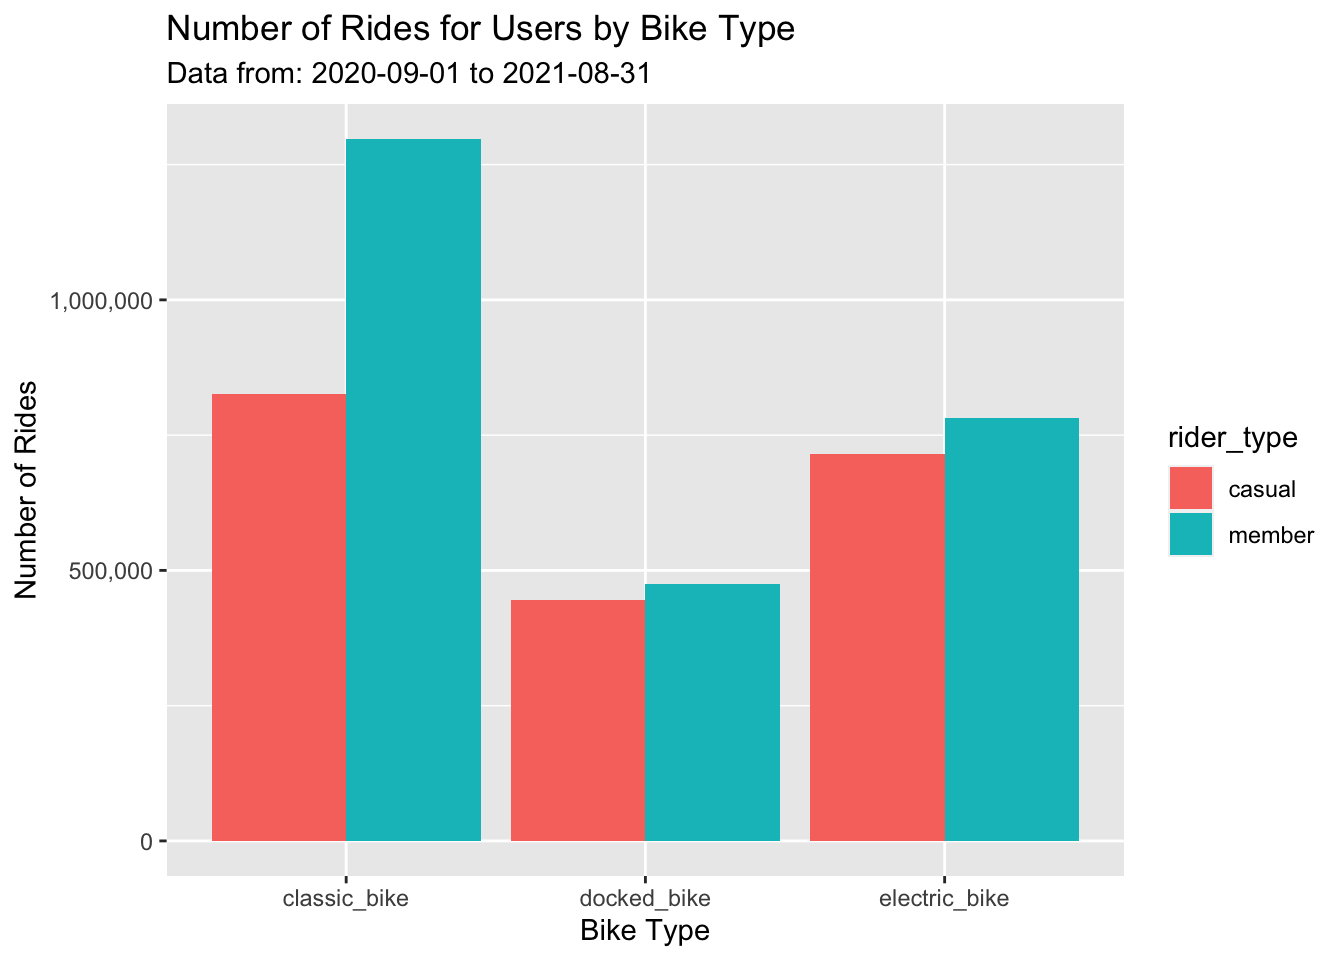
- In general, users use classic bikes the most, followed by electric bikes and then docked bikes.
-
Annual members are generally more active than casual riders, but the latter is more active on weekends compared to mid-week. However, Sunday is the busiest day for both casual and member riders.

- Despite casual riders having longer bike rides than annual members, the average distance travelled by both users is roughly the same.
-
Most rides last less than an hour, with the vast majority of rides lasting 20 minutes or less.
Trends and relationships
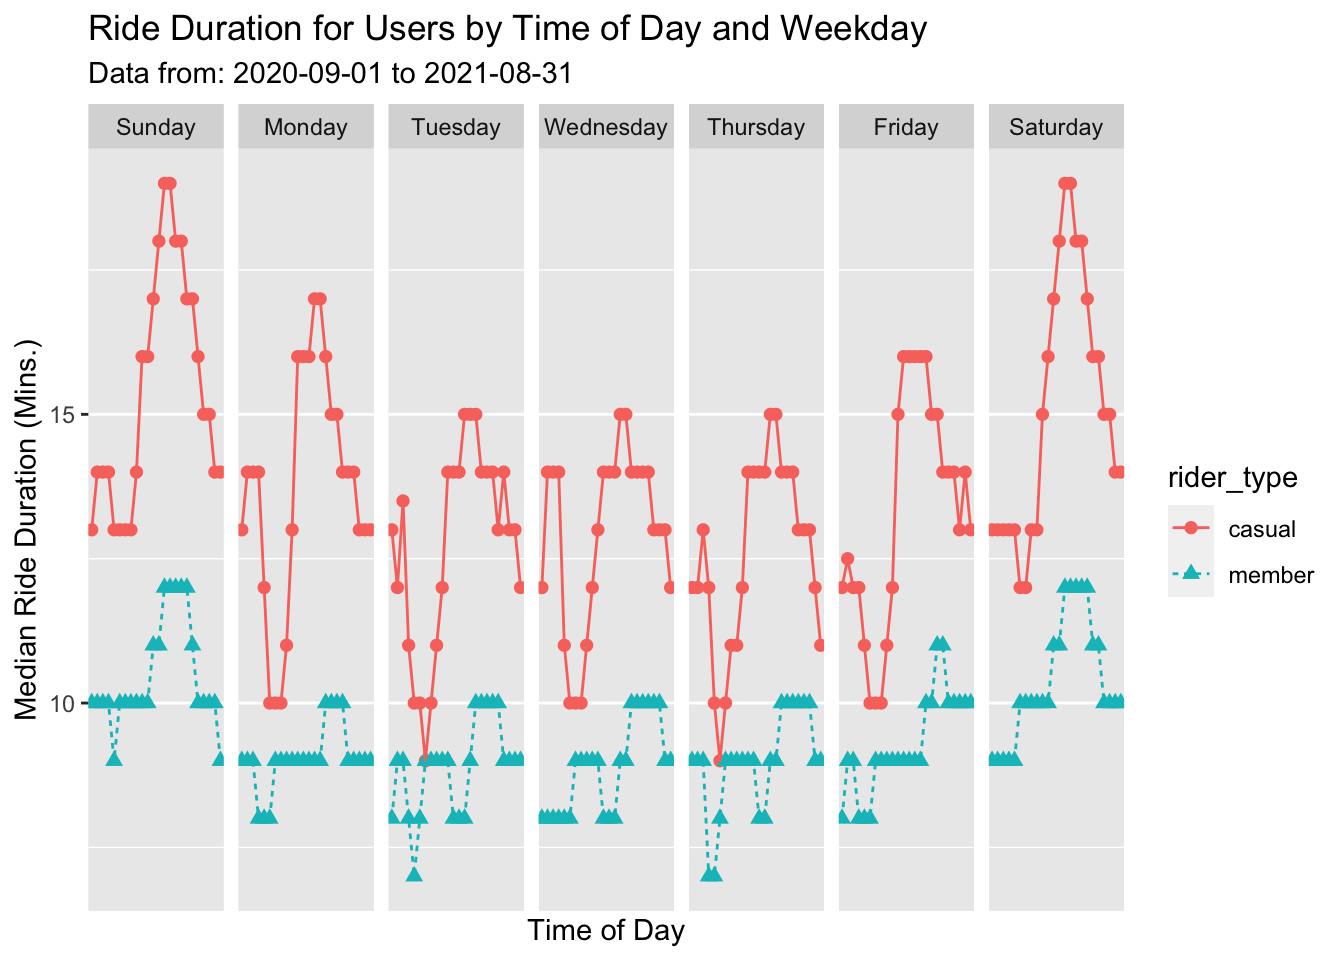
- In terms of daytime activity, Casual riders are very active from late night to dawn, while annual members are more active in the early morning. However, mid-day activity is about 50-50 between casual and member riders.
- Generally, the longest rides happen on weekends, while the shortest trips occur early mid-week.\
-
Casual riders tend to take longer rides - especially for mid-day and weekend rides. Members are more active than casual riders earlier in the day.
-
Year-round, annual members are more active than casual riders except during the summer. In addition, summer is the busiest period of the year, while winter is the least active period, especially for casual riders.

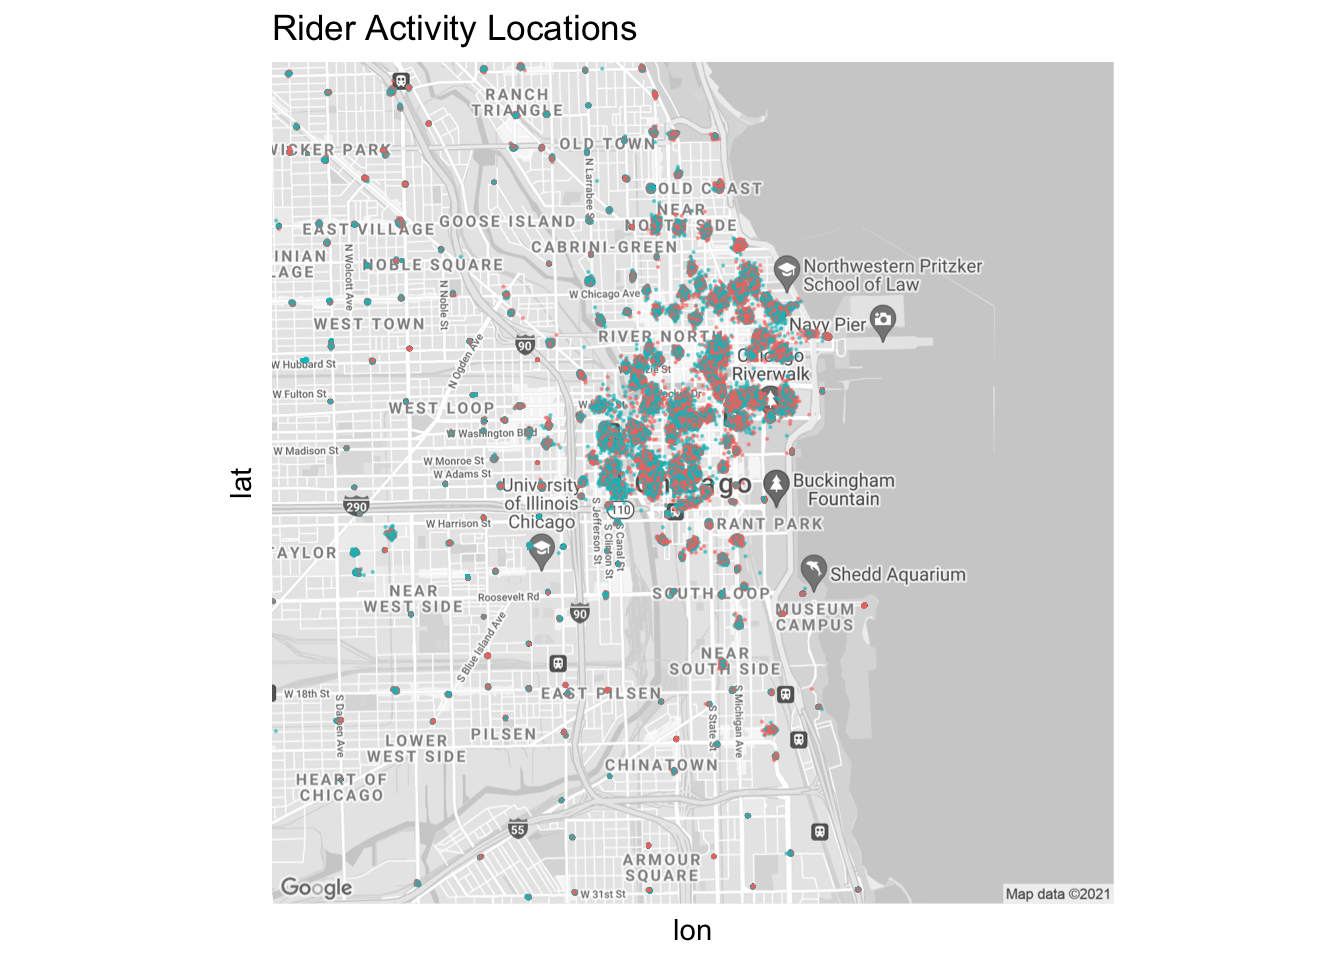
-
Majority of the bike trips occur near the coast. However, annual members are more spreadout compared to casual riders. The latter is concentrated around the coast.
Conclusion
The purpose of the case study is to discover and report actionable insights to inform decision-making on a possible casual rider to annual member conversion marketing strategy. To convert casual riders to annual members it is imperative to understand
why both groups differ to create new policies to convince casual riders to become annual members. Currently, the available data only reveals how both groups differ, which would be fine if a conversion strategy was
not the primary goal.
Hence, Cyclistic should not move forward with a conversion marketing strategy at the moment as it would be too risky because of the absence of sufficient data. Instead, revising the data
collection process to collect demographic and qualitative data would be the best course to devise a conversion strategy.
Hypotheses
- Annual members use cyclistic for leisure and for commuting to and from work.
- Casual riders use Cyclistic majorly for leisure.
justifications
For annual members:
- They are very active in the morning (5:00 am to 9:00 am).
- They are active during the evening rush hour when work is expected to be over for the day.
- They use bikes consistently each week throughout the year.
For casual riders:
- They are not active in the mornings
- They are not active during the winter
- They are more active on weekends than on weekdays
- They are very active mid-day and late nate night on weekdays
- They take longer bike rides
recommendations
data collection revision
As stated earlier, Cyclistic should not move forward with a conversion marketing strategy at the moment as it would be too risky. Instead, the focus should be revising the data collection process to collect demographic
and qualitative data.
To confirm whether the hypotheses discussed earlier are factual or not or to discover some new significant behavioural differences between casual riders and annual members:
- Survey Cyclistic users: A representative sample of users will need to be surveyed to determines their motivations, opinions and experiences. The qualitative data gathered will provide proper context to the findings from this case study.
- Include user demographic data: Demographic data provides more insight into who the average casual rider or annual member is. This data will significantly inform a conversion strategy.
Deciding to Move Forward Regardless
Should Cyclistic choose to move forward with the conversion strategy based on insights from this analysis, the company must be prepared to execute additional risk and cost-benefit analyses on the proposed strategies. That said, the top three recommendations are as follows:
- Consider an alternative to conversion: A more convenient approach that can drive growth would be to establish new pricing models or services. In particular, a unique annual weekend offering that offers unlimited rides on weekends throughout the year. Another alternative could be a summer offering that grants unlimited rides all through summer. from this case study.
- A benefit-based marketing strategy: This method would require Cyclistic to run individual campaigns on the physical, mental and environmental benefits. By following this strategy, Cyclistic would target casual riders who have fitness goals, want to reduce stress, and are very eco-friendly.
- Include annual member subscription privileges: This method involves introducing more privileges for annual members. These could include the right of first refusal if they are near a docking station or the ability to use an extra bike for a friend (could be very applicable in the summer, as casual riders most likely do not bike alone). This strategy is precarious because it does not guarantee casual rider conversion. Nevertheless, it would be beneficial to address the pain points of annual members.